أدوات تطوير ODD: أداة تصحيح لتطبيقات ODD
ODD Devtools is a browser extension designed specifically for debugging applications that utilize the ODD SDK. Developed by Fission, this free tool allows developers to effectively log session and file system events across domains and app namespaces. With ODD Devtools, developers can gain valuable insights into the state of their applications, including information such as ODD SDK version, data root CID, username, account DID, agent DID, and capabilities.
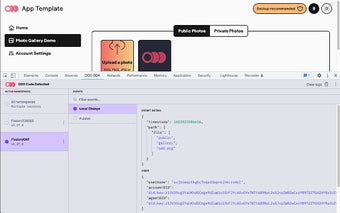
To get started with ODD Devtools, simply set the debug mode to true in your ODD program. Once done, open the devtools and navigate to the ODD SDK tab. The ODD Devtools will seamlessly connect to the ODD SDK and automatically start logging events as they occur.
One of the standout features of ODD Devtools is its ability to organize event logs by app namespace. This is particularly useful when debugging multiple apps or when one app requests capabilities from another. Users can easily filter events by selecting a specific namespace from the left panel or choose to view all events by selecting "All Namespaces".
Additionally, users can further refine their search by entering a search term into the filter input. The filter function will search for matches in any event payload value, allowing developers to focus on specific aspects of their application. For example, entering "private" will filter the events to show only changes to the private file system.
With its comprehensive debugging capabilities and intuitive interface, ODD Devtools is an essential tool for developers working with ODD applications. Whether you're a seasoned developer or just starting out, this Chrome extension will greatly enhance your debugging process.